Working With Cohorts
Cohorts are an way of creating custom groupings of the samples and/or cases that you are interested in analyzing further. You may frequently re-use a cohort in multiple analyses. Creating a “saved cohort” allows you to do this. If you have any existing saved cohorts, they will appear here for you to view, edit and share (see below for details).
Creating and saving a cohort
To create a cohort from Your Dashboard, if you do not have a cohort created, click on the “Filter” or the “Barcodes” links in the “Saved Cohorts” panel at the bottom of the page. The Filter link will take you to the cohort creation page with all filters explained below. The Barcodes link will send you to a page where you can uplaod samples/cases barcodes and create a cohort from them. Currently you can only upload from three programs TCGA, CCLE, and TARGET.
If you already have saved cohorts, they will be listed in the “Saved Cohorts” panel. Click on the “Saved Cohorts” link in that panel and this will take you to a page that displays the details of your saved cohorts. Alternatively, to go directly to a given cohort, click on its name and you will be taken to the cohort details page of that cohort.
To create a new saved cohort, use the “Create Cohort: Filters / Barcodes” link.
Cohort Creation Filters Page
Using the provided list of filters on the left hand side, you can select the attributes and features that you are interested in either from ISB-CGC data or the User Data tab. TCGA Data is the first program to be displayed, next to it is CCLE and TARGET Data tabs. You are able to create a cohort with multiple program filters. CCLE (The Cancer Cell Line Encyclopedia) data - is open access data set that can be used to view sequence data with the IGV viewer without having dbGaP permissions.
By clicking on a feature, the field will expand and provide you with additional filtering options. For example, when you click on “Vital Status”, it expands and provides a list containing “Alive”, “Dead”, and “NA” as options you may choose from. Selecting one or more of these will cause the filter(s) to appear in the Selected Filters panel and visualizations on the page will be updated to reflect that the current cohort has been filtered according to Vital Status. The numbers beside the selectable filter values reflect the number of samples that have that attribute based on all other filters that have been selected.
Individual selections in a filter are “ORed” together, meaning if any of the selected conditions are met they will be in the filter. Filters are “ANDed” together, meaning that selecting two filters means that the cases and samples are created based on both filters being executed. There may be cases where you have 0 cases and samples, because the combination of filters you have chosen are ALL not present (AND function).
Program Selection Panel
The panel in the center of the screen, with four tabs called “TCGA DATA”, “CCLE DATA”, “TARGET DATA”, and “USER DATA” will allow to create a cohort between data programs in the system and data that you have uploaded. The TCGA, CCLE, and TARGET DATA tab each have three tabs called “CASE”, “DATA TYPE”, and “MOLECULAR” which allow you to apply filters to the cohorts your are creating using ISB-CGC hosted data. For the USER DATA tab, there is one tab called “PROJECTS & STUDIES” which allow you to filter by the projects or studies you have uploaded to the system. Below are the details of each tab.
Please Note: Selecting the program filter will add all samples pertaining to program. Also there is a mouse over feature that will display the disease code long name if it’s part of the TCGA, CCLE, or TARGET dataset.
TCGA Cases Tab TCGA Data Type Tab CCLE Cases Tab TARGET Cases Tab TARGET Data Type Tab Program Pathology Image Program Program mRNA Gene Quantification Project Short Name Somatic Mutation Project Short Name Project Short Name miRNA Isoform Quantification Disease Code Copy Number Segment Masked Disease Code Disease Code miRNA Gene Quantification Vital Status mRNA Gene Quantification Gender Vital Status Aligned Reads Gender DNA Variation VCF Sample Type Gender Age at Diagnosis Aligned Reads Site Primary Age at Diagnosis Sample Type Protein Quantification Histology Sample Type Tumor Tissue Site miRNA Isoform Quantification Histological SubType Race Histological Type miRNA Gene Quantification Ethnicity Pathologic Stage mRNA Isoform Quantification WBC at Diagnosis Person Neoplasm Cancer Status Genotypes Year of Diagnosis Neoplasm Histologic Grade DNA Methylation Beta Event Free Survival BMI (Body Mass Index) Days to Last Followup HPV Status Days to Last Known Alive Residual Tumor Days to Birth Tobacco Smoking History Days to Death Race Ethnicity Year of Diagnosis Menopause Status Days to Last Known Alive Preservation Method
Molecular Tab
Gene Mutation Status (creating a cohort based on the presence of a mutation (of various types) in a gene or genes).
This is currently only available for TCGA data. To combine multiple gene filters, select AND (requires all filters to be met for the data to be filtered) or OR (at least one criteria needs to be met for the data to be displayed).
NOTE 1: If you use AND and do not see the data you are expecting in the filter, try OR instead. AND is a more restrictive criteria requiring all filters to be met, OR is less restrictive, requiring only one criteria to be met for the data to appear.
NOTE 2: Please add in your saved cohort title the term AND or OR for the combination you used, as the type of combination used in your cohort does not currently appear in the summary of filters in a saved cohort. We are working on this.
You can also filter by different genomic builds and hence different BigQuery Tables. The two BigQuery tables you can select from are TCGA_hg19_data_v0:Somatic_Mutation_MC3 and TCGA_hg38_data_v0:Somatic_Mutation.
Programs & Projects Tab
- User Program
- User Project
Save As New Cohort Button
Push this button if you wish to save the cohort based on the filters you have set. You will be asked for a cohort name and the selected filters will be displayed. Enter the name (any text) and push the “Create Cohort” button.
NOTE: When working with multiple programs you will see a yellow notification box stating, “Your cohort contains samples from multiple programs. Please note that filters will only apply to samples from the program indicated by the tab they were chosen on - they will not apply to samples from other programs in this cohort.”
Selected Filters Panel
This is where selected filters are shown for each program so there section to see what filters have been selected. You have to toggle between program tabs to see the filters selected for each program.
If you have not saved the cohort yet, clicking on “Clear All” will remove all selected filters for that program. Also, if you have not saved the cohort yet, selecting an X beside a single filter will remove that filter. If you have saved the cohort, the X is not present as this function is disabled in saved cohorts (to add back to an existing cohort, you can use set operations - see below).
Details Panel
This panel shows the Total Number of Samples and Total Number of Cases in a cohort that is actively being created with the filters that have been selected. If there is a small “timer” icon, the calculation is taking place - the results should appear soon.
Clinical Features Panel
This panel shows a list of images (called “treemaps”) that give a high level breakdown of the selected samples for a handful of features for the selected program:
TCGA Clinical Features Panel CCLE Clinical Features Panel TARGET Clinical Features Panel Disease Code Disease Code Disease Code Vital Status Gender Vital Status Sample Type Site Primary Gender Tumor Tissue Site Histology Sample Type Gender Histological SubType Age At Diagnosis Age At Initial Pathologic Diagnosis
By using the “Show More” button, you can see the last two tree maps. Mousing over an image shows the details of each specific section of the image and the number of samples associated with it.
Data File Availability Panel
NOTE: this function is now available only when editing a created cohort. To access this function, please create the cohort and edit it as described below.
This panel shows a parallel sets graph of available data files for the selected samples in the cohort. The large headers over the vertical bars are data types. Each data type (vertical bar) is subdivided according to the different platforms that were used to generate this type of data (with “NA” indicating samples for which this data type is not available). Each sample in the current cohort is represented by a single line that “flows” horizontally from left to right, crossing each vertical bar in the appropriate segment.
Hovering on a swatch between two vertical bars, you will see the number of samples that have data from those two platforms.
You can also reorder the vertical categories by dragging the headers left and right and reorder the platforms by dragging the platform names up and down.
Programs & Projects Panel
This panel displays a list of images (called “treemaps”) similar to the clinical features panel, but can only be found when the User Data tab is selected. This panel displays a high level breakdown of the projects and studies you have uploaded to the system. Another similarity to the clinical features panel hovering over the image will show details of the specific section of the image and the number of samples associated with it.
Cohort Creation Barcodes Page
This feature will allow you upload or enter your own list of sample or cases barcodes from multiple programs. There is a blue instructions button present on both the upload and Enter tabs.
Below is an example of what you are provided when the Instructions tab is selected.
All entries must contain a valid case barcode or sample barcode, and a valid program short name.
Valid program short names:
- TCGA
- CCLE
- TARGET
When only a case barcode is provided, all samples from that case will be included in the cohort. Make a separate entry per sample if only specific samples from a case should be added to the cohort.
Please do not include any column headers. Values may be placed in single or double quotes. Format your entries as follows:
Case Barcode,Sample Barcode,Program Short Name
When omitting either barcode type, please be sure to still include the empty column’s delimiter. (See examples below.) You may place an empty quoted value (“” or ‘’), but this is optional.
**Example Barcode Set**

TCGA-N9-A4Q4,,TCGA
,TCGA-N7-A4Y8-01A,TCGA
'Saos-2','CCLE-Saos-2', 'CCLE'
'Hs 863.T', '','CCLE'
"TARGET-51-PAJLIV",, "TARGET"
TARGET-51-PAJMFS,"", "TARGET"
Upload Tab
This feature allows to upload files with barcodes to create a cohort. Files must be in GDC Data Portal case manifest format, or in comma/tab-delimited case/sample/program format. The file can be a maximum of 32MB. Also, files must be in tab- or comma-delimited format (TSV or CSV) and have an extension of .txt, .csv, or .tsv. After selecting the file and uploading it, the entries will be validated. Any entries which are found to be invalid will be listed, and you can choose to omit them and continue with cohort creation, or select a new file for verification and upload.
GDC Data Portal Case Manifest Files
GDC Data Portal case manifests can be obtained on the ‘Cases’ tab of the Exploration section of the data portal ‘Cases’ tab of the Exploration section of the data portal. JSON case manifests must have a .json extension, and will be validated against the GDC’s JSON schema. The minimum required properties for each entry in the JSON file are the project object and the submitter_id field. The project object must include the project_id property. All other properties will be ignored.
TSV case manifests must have a .tsv extension, and must contain the first 3 columns of the GDC TSV case manifest in the following order: Case UUID, Case ID, Project. Any other columns will be ignored. Do not remove the header row of the TSV case manifest.
Because the GDC Data Portal case manifest entries are cases, all samples from a case will be included in the cohort.
Enter Tab
This feature will allow you to manually input barcodes for cohort creation. There is a maximum length of 10000 character for the text box. Please use the file upload option if you need to upload more barcodes than will fit in that space.
Operations on Cohorts
Viewing and Editing a Cohort
Once you have created a “Saved Cohort” you can view and edit it. To view a cohort, select it by clicking on its name either from the “Saved Cohorts” panel on the main “Your Dashboard” page or on the “Cohorts” page listing all your saved cohorts.
When you have gone to the “Cohorts” page, you will be shown details of the cohort on the “SAVED COHORTS” tab. The “PUBLIC COHORTS” tab shows public cohorts that are commonly selected. Public cohorts can be used for a “New Workbook” and “Set Operations”.
From the “COHORTS” page you can select:
- New Workbook: Pushing this button creates a New Workbook using the selected Cohorts
- Delete: Allows you to delete selected cohort(s) (if you confirm by clicking the second delete button presented)
- Set Operations: Allows you to perform set operations on selected cohorts (see below for details)
- Share: This will share the web view of the cohorts with users you select by entering the users e-mail. If the email address you entered in not registered in the database you are prompted with a message saying, “The following user emails could not be found; please ask them to log into the site first:(email entered).”
Set Operations
You can create cohorts using set operations on the Cohorts page.
To activate the set operations button, you must have at least one cohort selected in your “Cohorts” page. Upon clicking the “Set Operations” button, a dialogue box will appear. Now you may do one of the following:
- Enter in a name for the new cohort you’re about to create.
- Select a set operation.
- Edit cohorts to be used in the operation.
- Add A Cohort
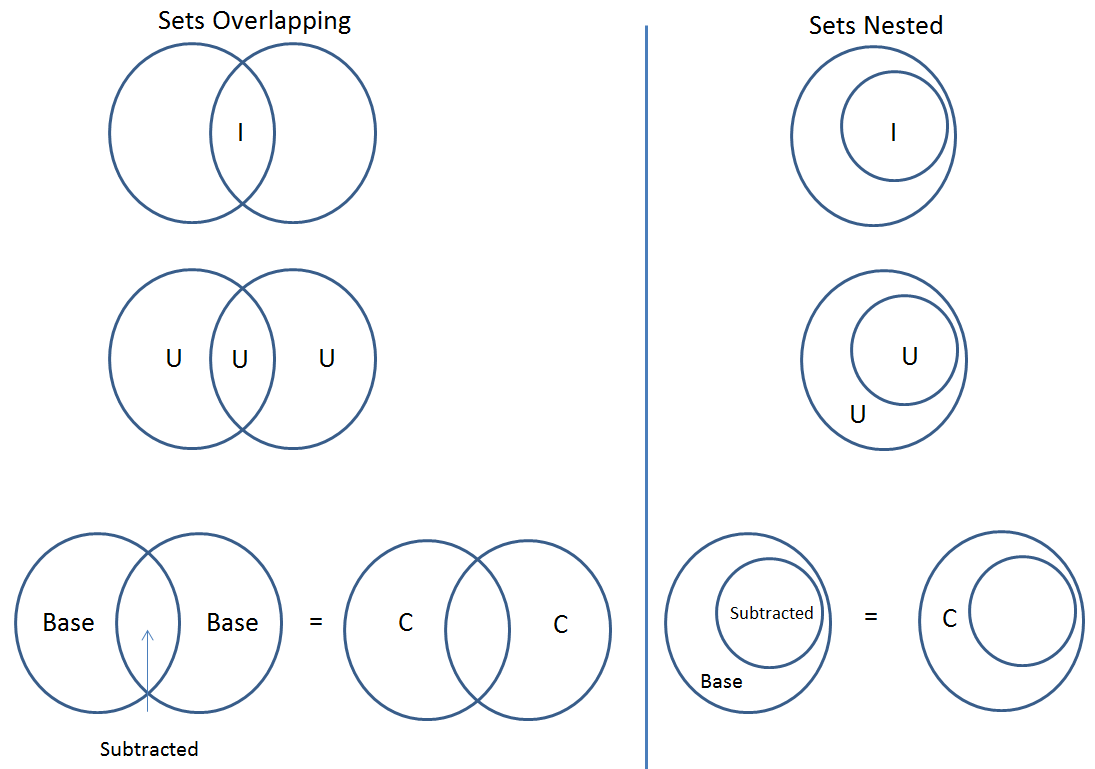
The intersect and union operations can take any number of cohorts and in any order. The complement operation requires that there be a base cohort, from which the other cohorts will be subtracted from.
Note: To combine the User uploaded data and the ISB-CGC data, use the Set Operations function. This is possible since the list of barcodes is what is used to create the set operation. For example, to make a cohort of user data samples and ISB-CGC curated samples, Set Union must be used, and to filter user data which is an extension of TCGA or TARGET samples, Set Intersection must be used.
The figure below shows what the results of the set operations will be (represented by I for Intersect, U for Union, and C for Complement). There are two types of sets shown, those that overlap (on the left) and those that are nested (on the right). For the last row (complement operations), the “Subtracted” area is removed from the “Base” area to result in the Complement (C).
Click “Okay” to complete the set operation and create the new cohort.
Cohort Details Page
The cohort details page displays the details of a specific cohort. The title of the cohort is displayed at the top of the page.
From the “SAVED COHORTS” tab you can:
- New Workbook: Pushing this button creates a New Workbook using the cohort
- Edit: Pushing this button makes the filters panel appear. And filters selected will be additive to any filters that have already been selected. To return to the previous view, you must either save any NEW selected filters (with the “Save Changes” button), or choose to cancel adding any new filters (by clicking the “cancel” link).
- Comments: Pushing “Comments” will cause the Comments panel to appear. Here anyone who can see this cohort can comment on it. Comments are shared with anyone who can view this cohort. They are ordered by newest on the bottom. Selecting the “X” on the Comments panel will close the panel. Any user who owns or has had a cohort shared with them can comment on it.
- Duplicate: Making a copy will create a copy of this cohort with the same list of samples and cases and make you the owner of the copy. This is how you create a copy of another researchers cohort that they have shared with you (note: If they later change their cohort, your cohort will not be updated, it will remain the same as it was at the time you duplicated it).
- Delete: Allows you to delete this cohort (if you confirm by clicking the second delete button presented)
- File Browser: Allows you to view the list of files associated with this cohort (see details below)
- CSV: Provides a list of sample and cases IDs in the cohort
- BigQuery: This will allow you to create a new table or append to an existing table. You must have registered a BigQuery dataset with a Google Cloud Project on the registered Google Cloud Projects details page. More information on how to register a BigQuery dataset can be found here. If a user wants to export their cohort to a premade table of their own, we require it to have the necessary columns. Here’s the schema:
{
      'fields': [
          {
              'name': 'cohort_id',
              'type': 'INTEGER',
              'mode': 'REQUIRED'
          },{
              'name': 'case_barcode',
              'type': 'STRING',
              'mode': 'REQUIRED'
          },{
              'name': 'sample_barcode',
              'type': 'STRING',
              'mode': 'REQUIRED'
          },{
              'name': 'project_short_name',
              'type': 'STRING',
              'mode': 'REQUIRED'
          },{
              'name': 'date_added',
              'type': 'TIMESTAMP',
              'mode': 'REQUIRED'
          },{
              'name': 'case_gdc_uuid',
              'type': 'STRING'
          }
      ]
  }
Note: You shouldn’t ever set UUID to ‘required’ because sometimes a sample doesn’t have a UUID, and the attempt to insert a ‘null’ will cause the cohort export to fail.
- GCS: This will save the details of the cohort in a Google Cloud Storage location specified by you. You must have a registered Google Cloud Storage (GCS) bucket with a Google Cloud Project on the registered Google Cloud Projects details page. More information on how to register a GCS bucket can be found here. You will be able to select the file format to export into Cloud Storage, either CSV or JSON. All files are exported are converted into zip files.
- Share: This will share the web view of the cohorts with users you select by entering the users e-mail. If the email address you entered in is not registered in the database you are prompted with a message saying, “The following user emails could not be found; please ask them to log into the site first:(email entered).”
Current Filters Panel
This panel displays current filters that have been used on the cohort or any of its ancestors. If you have selected multiple These cannot be modified. To add additional filters to this list use the Edit button.
Details Panel
This panel displays the Internal ISB-CGC Cohort ID (the identifier you use to programmatically use this cohort through our APIs ), and the number of samples and cases in this cohort. The number of samples may be larger than the number of cases because some cases may have provided multiple samples. This panel also displays “Your Permissions” which can be either owner or reader, as well as revision history. If you have edited the cohort, the filters that were used to originally create the cohort are displayed under the “Creation Filters” label, the newly applied filters since original creation are displayed under the “Applied Filters” label.
TCGA DATA, CCLE DATA, TARGET DATA and USER DATA Tabs
Selecting any program tab will be enabled if you have selected filters for that program. By selecting the tab you will display the Clinical Features panel and the Data File Availability panels for the program selected.
Clinical Features Panel
This panel shows a list of tree maps that give a high level break of the samples for a handful of features for the program view selected:
TCGA Clinical Features Panel CCLE Clinical Features Panel TARGET Clinical Features Panel USER DATA Programs & Projects Panel Disease Code Disease Code Disease Code Program Vital Status Gender Vital Status Project Sample Type Site Primary Gender Tumor Tissue Site Histology Sample Type Gender Histological SubType Age At Diagnosis Age At Initial Pathologic Diagnosis
Data File Availability Panel
This panel shows a parallel sets graph of available data files for the selected samples in the cohort. The large headers over the vertical bars are data types. Each vertical bar may be broken up to represent different platforms used to generate that type of data (and “NA” for samples for which that data type is not available). The sets of lines that “flow” from left to right indicate the number of samples for which each type of data files are available. If you hover over a horizontal segment between two bars, you will see the number of samples that have both those data type platforms. You can also reorder the vertical categories by dragging the headers left and right and reorder the platforms by dragging the platform names up and down.
File Browser Page
“File Browser” takes you to a new page where you can view the complete list of data files associated with your current the cohort. The file list page provides a paginated list of files available with all samples in the cohort. Here, “available” refers to files that have been uploaded to the ISB-CGC Google Cloud Project, including both controlled access and open access data. You can use “Show”, “Page”, “Previous” and “Next” navigation tools to navigate to more values in the list. The columns are sortable by selecting the column header. You can select a subset of the default columns to show by using the “Choose Columns to Display” tool.
You can filter by Genomic Build either HG19 or HG38 and view which platforms and files are available for the build selected. You can enter a case barocde on all tabs as a filter option. You also have the ability to do a partial string search. To remove the search key word you click the clear “X” button. After useing the case search button the filter count is updated for the rest of the filters. You may also filter on these files if you are only interested in a specific data type, data format, platform, disease code, disease strategy, and/or experimental strategy. Selecting a filter will update the associated list. The numbers next to the filter refers to the number of files available for that filter.
The tabs “IGV”, “Pathology Images” and “Radiology Images” allow you to filter for files that show you respectively read-level sequence data (viewed using the IGV viewer), pathology images, and radiology images. Please note: only if you have authenticated as a dbGaP authorized user will you be able to select controlled access files to view in the IGV viewer (CCLE data does not require authorization to view the sequence data in the IGV viewer). Details of how to view Sequences, and Pathology and Radiology images are provided below.
Download File List as CSV
To download a list of files that are part of this cohort, select the button in the upper right on the File Listing panel (on all tabs) called “CSV”. This will begin a download process of all the files available for the cohort, taking into account the selected filters.
The file contains the following information for each file:
- Case Barcode
- Sample Barcode
- Program
- Platform
- Experimental Strategy
- Data Category
- Data Type
- Data Format
- Genomic Data Commons(GDC) File UUID
- Google Cloud Storage(GCS) location
- Genomic Data Commons(GDC) Index
- Index File Google Cloud Storage(GCS) location
- File Size
- Access Type (open or controlled access)
Export File List to BigQuery
To export the File list to BigQuery, select the button BigQuery. You will need to have registered a Google Cloud Project and a BigQuery dataset to be able to export to BigQuery. More information on how to register a BigQuery Dataset can be found here. You can either make a new table or append an existing table. You can also give the table a unique name if left blank we will provide a name for the table.
The table will contain the following information (for each of the data type tabs):
- row
- cohort_id
- case_barcode
- sample_barcode
- project_short_name
- date_added
- build
- gdc_file_uuid
- gdc_case_uuid
- platform
- exp_strategy
- data_category
- data_type
- data_format
- cloud_storage_location
- file_size_bytes
- index_file_gdc_uuid
- index_file_cloud_storage_location
Export File List to Google Cloud Storage
To export the File list to Google Cloud Storage (GCS), select the button GCS. You will need to have registered a Google Cloud Project and a GCS Object to be able to export to GCS. More information on how to register a GCS bucket can be found here. You can also give the object a unique name if left blank we will provide a name for the bucket. You can either choose to export as JSON or CSV file and all files exported are converted into zip files.
The file will contain the following information (for each of the data type tabs):
- sample_barcode
- case_barcode
- cloud_storage_location
- file_size_bytes
- platform
- data_type
- data_category
- exp_strategy
- data_format
- gdc_file_uuid
- gdc_case_uuid
- project_short_name
- cohort_id
- build
- index_file_storage_location
- index_file_gdc_uuid
- date_added
Viewing a Sequence
When available, sequences in a cohort can be viewed using the IGV viewer. To find those sequences that can be viewed with the IGV viewer, open a cohort and select the “View Files” button at the top of the page. The files associated with your cohort will be shown, a tab displaying the files that can be viewed with the IGV viewer. Selecting the check-box in the “View” column (for a maximum of 5 files) and the “Launch IGV” button in the upper window will take you to an IGV view of the selected sequence(s) data. Controlled access files will be viewable by sequence ONLY if you have authenticated as a dbGaP-authorized user.
(more information about Viewing a Sequence in the IGV Viewer).
Using the Image Pathology Viewer
When available, pathology images can be viewed using the caMicroscope tool (see more about caMicroscope provide here ). These are the pathology images that are associated with TCGA samples (not all files are currently available, due to some metadata that is not in place at GDC describing the image files. ISB-CGC is working with GDC to resolve this issue, and more images will be appearing when that issue is resolved). To find images that can be viewed, open a saved cohort and select the “File Browser” button at the top of the page. You can also select the File Browser button from the Dashboard Saved Cohorts panel. The files associated with your cohort will be shown, with the third tab listing any available Pathology Images. Hovering over the File Name column and clicking on ‘Open in caMicroscope’ will open the image file in a new tab using caMicroscope (HINT: using a smaller cohort will provide faster response in creating the list of files available).
To zoom into the image, either click the left button or use your wheel to zoom in. Use your mouse to move around the image. To zoom out of the image, shift-slick the left mouse button or use your wheel to zoom out. Selecting caMicroscope at the top of page will send you to the caMicroscope homepage. If you hover over the Slide Barcode section on the top right hand side you will see metadata information listed.
Viewing a Radiology Image
To find images that can be viewed, open a saved cohort and select the “File Browser” button at the top of the page. You can also select the File Browser button from the Dashboard Saved Cohorts panel. The files associated with your cohort will be shown, with the fourth tab listing any available Radiology Images. Hovering over the Study Instance UID column and clicking on ‘Open in Osimis Web Viewer’ will open the series Selection panel in a new tab using Osimis DICOM (HINT: using a smaller cohort will provide faster response in creating the list of files available).
For a more detailed step-by-step process of Viewing Radiology Images using the Osimis DICOM viewer please go here.
Deleting a cohort
From the “COHORTS” page: Select the cohorts that you wish to delete using the checkboxes next to the cohorts. When one or more are selected, the delete button will be active and you can then proceed to deleting them.
From within a cohort: If you are viewing a cohort you created, then you can delete the cohort using the delete button on the menu.
Creating a Cohort from a Visualization
To create a cohort from visualization, you must be in plot selection mode. If you are in plot selection mode, the crosshairs icon in the top right corner of the plot panel should be blue. If it is not, click on it and it should turn blue.
Once in plot selection mode, you can click and drag your cursor of the plot area to select the desired samples. For a cubbyhole plot, you will have to select each cubby that you are interested in.
When your selection has been made, a small window should appear that contains a button labelled “Save as Cohort”. Click on this when you are ready to create a new cohort.
Put in a name for you newly selected cohort and click the “Save” button.
Copying a cohort
Copying a cohort can only be done from the cohort details page of the cohort you want to copy.
When you are looking at the cohort you wish to copy, select Duplicate from the top menu.
This will take you to a new copy of the cohort.