Workbooks
- Workbooks store the Analyses you create – and their related data. Basically, the worksheets you create to conduct analysis based on the source data selected (i.e. Genes and miRNAs, Variables and Cohorts). Workbooks can be used to:
- Group together multiple related analyses,
- Share analysis results with specific groups of people,
For example, you can create a Workbook (i.e., Disease A) which consists of identifying gene mutations and pathways involved in Head and Neck Cancer (and share it with research Group A).
And to create another Workbook (i.e., Disease B) with a different group of researchers (Group B) investigating the average time after diagnosis of death for different lung cancers. Think of workbooks as virtual “excel spreadsheets” that various related analyses can be created in individual Worksheets (“Tabs” within the spreadsheet) and grouped together in one Workbook (the overall spreadsheet).
- Additionally, you can:
- Save a Workbook for later use, or
- Edit an existing Workbook.
Creating and Saving a Workbook
From your Dashboard, you will find the “Saved Workbooks” panel. This panel displays any previously created, Saved Workbooks, also you are able to “Create a New Workbook”. If you do not have any saved workbooks you will see “Workbooks store the analyses you create, and their related data.” text in the panel.
To create a Workbook from Your Dashboard, click on the “Create a New Workbook” link in the “Saved Workbooks” panel. This will take you to the Workbook creation page.
Note: If you wish to use your own data in graphing, please review the documentations on how to upload your own data and on how to graph your own data. Using your own data uses a slightly different approach than is described here.
ANNOUNCEMENT: For OncoPrint, OncoGrid, and SeqPeek analyses we now provide a default gene list. Genes with consensus score of 6 or higher are added to the default gene list. (Ref: Bailey et al., Cell. 2018 Apr 5;173(2):371-385.e18. doi: 10.1016/j.cell.2018.02.06 )
- From the Workbook creation panel you will first select one of six analysis types (i.e., Bar chart, Histogram, Scatter Plot, Violin Plot, Cubby Hole Plot or SeqPeek).
Analysis Type Description
- Bar Chart - This chart is used to plot a single categorical feature for one or more cohorts. It generates vertical lines to represent the type of data being used. The X axis shows categorical information being used while the other y axis, displays categorical data chosen in the edit analysis settings.
- Histogram - This chart is used to plot a single numerical feature for one or more cohorts. It generates vertical lines to represent the type of data being used. The X axis shows numerical information being used while the other y axis, displays numerical data chosen in the edit analysis settings.
- Scatter Plot - This chart is used to plot two numerical features (x & y axis) for one or more cohorts. Can also color code points by a single categorical feature.
- Violin Plot - This chart is used to plot a categorical feature on the x-axis versus a numerical feature on the y-axis. Points in the plot can be colored by another categorical feature.
- OncoPrint - This chart is used to plot multiple genomic alteration (somatic mutation) events across a set of samples using color-coded glyphs. OncoPrint is developed and provided by cBioPortal.
- OncoGrid - This chart is used to visualize the top mutated genes across programs/projects and the number of cases affected. We are also able to view the mutation frequency, clinical data, data format types, number of gene sets and the number of cases affected.
- Cubby Hole Plot - This chart is used to plot two categorical features. Boxes are colored by their related p-values.
- SeqPeek - This visualization shows where somatic mutations have been observed on a linear representation of a specific protein. Each horizontal strip represents the protein, with data from different tumor types (aka cohorts or studies) shown stacked one on top of the other.
A researcher now has the option to make the axis logarithmic if the plot can display continuous numerical data for eg. mRNA expression levels.
Note: For Violin Plot and Scatter Plot you can select multiple cohorts as your Color By Feature. This will cause the Legend to list all the cohorts that the sample is associated to. Please be aware you’ll end up with lots of permutations if you have lots of samples that belong to many different cohorts.
- You will then select Genes and miRNAs or Variables (or, optionally both)
- Genes and miRNAs - This will display previously created “Gene and miRNA Favorites” which can be “Applied to Analysis” (see Gene and miRNA Favorites for details) or you can apply / create a “New Gene and miRNA List”).
You begin by naming the data set (Gene Type or Project Specific); the Gene and miRNA list you create here will automatically be added to your Gene and miRNA Favorites list and can be selected for additional analysis later.
Next select the Gene(s) and miRNA(s) you’re interested in (you can upload a specific list you’ve previously created/stored, select new Genes and miRNA by typing them into the input box (you will see that Genes and miRNAs will auto-display). If duplicate listings are entered they will be marked for your deletion or automatically dropped when saved. If an error or unknown item is entered it will also be flagged for your attention.
To aid in Gene selection, you can access the HGNC portal (Hugo Gene Nomenclature Committee) via the “View Gene Identifiers” link under this Menu selection. To aid in miRNA selection You can also access the miRBase portal via the “View miRNA Identifiers” for readily available miRNA identifiers.
This allows you to focus on specific results or queries.
- Variables - (this will display previously created “Variable Favorites” which can be “Applied to Analysis” (see Variable Favorites for details) or you can apply / create a “New Variable List”).
You begin by naming the new Variable; the Variable you create here will automatically be added to your Variable Favorites list and can be applied to other analysis later.
- Next you can select variables from five (5) available data sources to incorporate in your Variables-
- TCGA - Common (22 options) and clinical search feature
- CCLE - Common (8 options) and clinical search feature
- TARGET - Common (16 options) and clinical search feature
- Favorite(s) - (Previously created variables which were Saved)
- User Data - Every program and data variable you have uploaded into system.
Then “Apply to Worksheet”
- Select your Cohort - Cohorts allow the user to create custom groupings of the samples and/or cases that can be used for further analysis.
By clicking ‘Cohorts’ or the ‘+’ symbol you will be directed to the Cohorts table where the user can either create a new cohort or choose from an existing cohorts. When creating a new cohort, after selecting your criteria you click the “Create Cohort” button. The button will become disabled (dimmed) as the Cohort builds (shown in the image below).
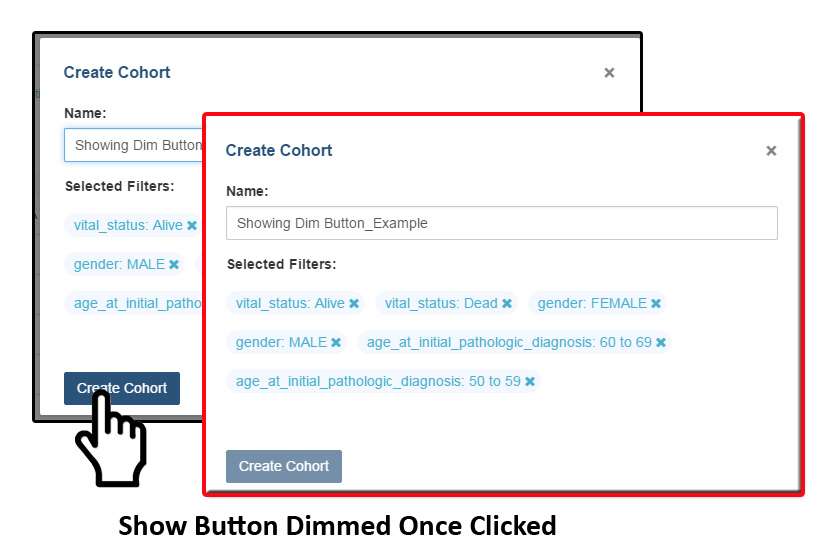
Once completed you can proceed. The user can also add multiple Cohorts to the worksheet if desired. More information about Cohorts can be found here.
- Select Edit Analysis Settings - This will trigger the Plot setting displaying the applicable x & y axis settings (i.e. Categorical or Numerical based on analysis type selected). Depending on the analysis type selected (e.g., Bar chart, Histogram, Scatter Plot, Violin Plot, Cubby Hole Plot, or SeqPeek) additional specifications may appear for selection.
- Select Toggle Sample Selection - After an analysis option has been selected, using the toggle sample button allows you to create a smaller cohort from within the plot itself.
- Select Redraw - After an analysis option has been selected, using the redraw button will reset the anaylsis to its orginal setting after being zoomed-in, moved place.
- Select Download - After an analysis option has been selected, using the download button will allow you to either download analysis as a SVG, PNG, or a JSON file.
- Select Toggle Full Screen - After an analysis option has been selected, using this button will enable the plot to full-screen.
Sharing Workbooks
This will share the web view of workbooks with users you select by entering the users e-mail. The User will receive an e-mail message with a link to your shared workbook explaining that (you) wanted to share a workbook with (them) and that you have invited them to join. If the email address you entered in not registered in the database you are prompted with a message saying, “The following user emails could not be found; please ask them to log into the site first:(email entered).”
Manipulation of Workbooks
Creating A Worksheet - By selecting the “+” next to an existing worksheet a user can create a new worksheet to create a new analysis. You can give the new worksheet an unique identifier and also give a description for the worksheet. This is ideal by allowing the user to easily have access to different graphs with the same data in the same workbook.
Worksheet Menu - The worksheet will have a section similar to the workbook menu where user can edit, duplicate or delete the worksheet. You can find the worksheet menu bar by clicking the arrow pointing down located next to the name of the worksheet that is opened.
Edit Analysis Settings - This function allows you to select new Plot Setting for selected analysis type.
Please Note: When selecting a gene or miRNA for either the x-axis or y-axis variable you be prompted with selecting a specification. If you select Gene Expression you have the option of choosing a Select Feature. If you select the Copy Number specification you can choose a Value Filter. If you select the Protein specification you can selelct a Protein Filter. If you select the Mutation specification you can select a Value Filter. If you select an miRNA expression you can select a select feature.
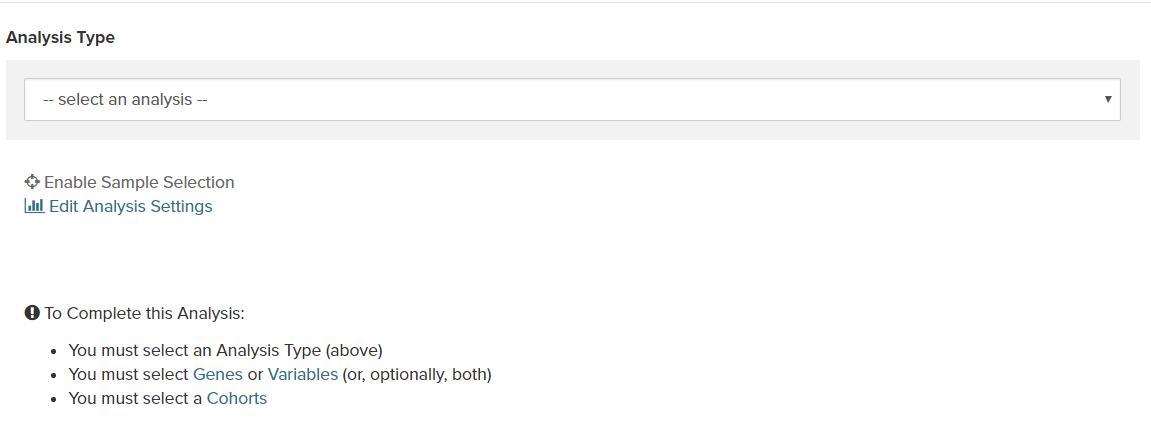
Enable Sample section and Edit Analysis Settings - Enable Sample Selection(shown in the image below) allows you to select samples from displayed analysis and save that selection to a new Cohort for further drill down analysis. The Edit Analysis Settings allows you to change the variables you wish to use for your analysis(varies by which analysis you choose). Finally, if you select miRNA you can select specification miRNA Expression, you will be prompted to select a feature.
Edit Details - This function allows the user to edit the name of the worksheet and also give a brief description on the worksheet being used for analysis. You can also change the build from HG19 to HG38 using this feature. Changing the build allows to graph data from either builds.
Duplicate - This function allows the user to create a duplicate worksheet in the workbook for further analysis and comparison.
Delete - This function will only appear when you are working with multiple worksheets. This will permanently delete the worksheet from the workbook.
Comments Section
Any user who owns or has had a workbook shared with them can comment on it. To open comments, use the comments button at the top right and select “Comments”. A sidebar will appear on the right side and any previously created comments will be shown.
On the bottom of the comments sidebar, you can create a new comment and save it. It should appear at the bottom of the list of comments.